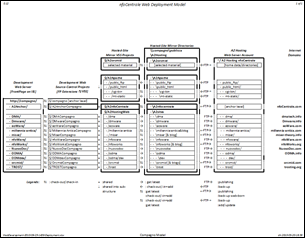
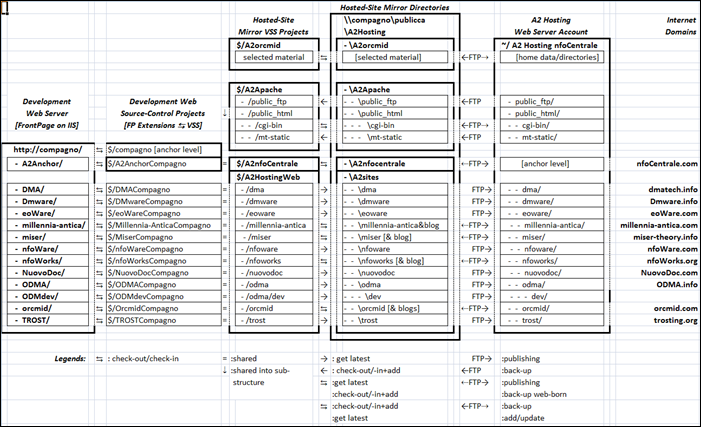
 When I had to become much more web-server savvy as part of having a private installation of Movable Type on my web-hosting account, I realized that my web site deployment and maintenance model had exceeded my mental grasp. I spent several days making diagrams using borders around groups of annotated spreadsheet cells. Although I could have used Visio, I found that Excel was much simpler for this kind of diagramming.
A full image of the diagram is not great for viewing on the web. But you can get a general sense of the way the pillars are connected, starting with my development web folders on the left and my Internet domains on the right. This image is better for keeping inside my notebooks where I can remind myself how to stage something I am working on.
This diagram is going to see heavy duty in defining and documenting the more-detailed procedures that make this work. A view of the worksheet itself is a little better for taking a closer look:
This is draft 0.12. I will be refining the diagram as I work through further details. Here is the Excel worksheet that I used for this version:


